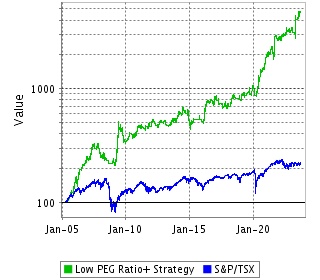
Portfolio Inception Date
April 15, 2005
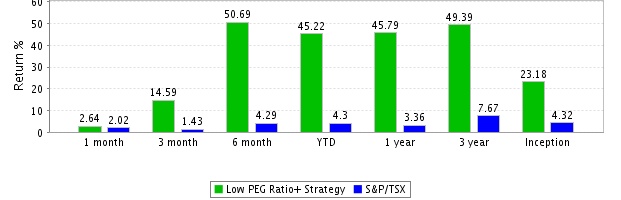
Benchmark
S&P/TSX Composite Index
Portfolio Objectives
To provide a long-term total return above the benchmark index by investing in Canadian stocks
selected by the Super Stock Picker system, a rigorous and disciplined approach to stock selection based
on their low peg ratio.
|
| DESCRIPTION |
- The Low PEG Ratio+ portfolio duplicates the Low PEG Ratio portfolio when the Market Timing Indicator is UP and is 100% cash when the indicator is DOWN. Note that the indicator signals are recorded live only since October 08. This approach is
based on the Super Stock Picker system that automatically and systematically manages this portfolio, it:
- Uses a clearly defined investment process.
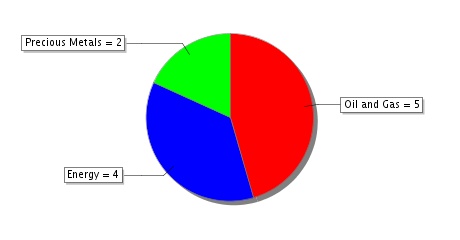
- Provides diversification by investment style, including both growth and value stocks from the Canadian market.
- Does not change based on market conditions or investment trends.
- Canadian stocks are selected based on research of the Toronto Stock Exchange from 2003 onwards.
|
|