Enter a symbol:
Toronto= :CA


You are here :  Home > Portfolios > Low PEG Ratio
February 03, 2012
Low PEG Ratio
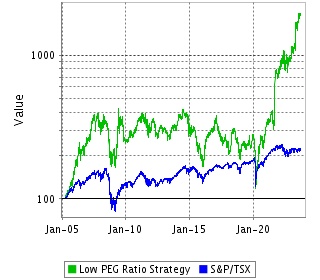
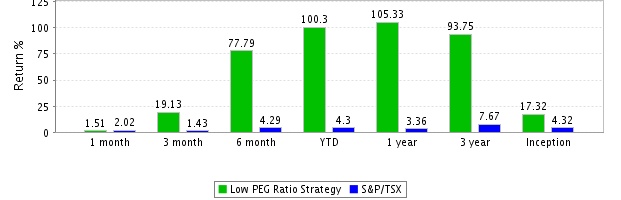
 Portfolio Inception Date
 April 15, 2005

 Benchmark
 S&P/TSX Composite Index

 Portfolio Objectives
 To provide a long-term total return above the benchmark index by investing in Canadian stocks selected by the Super Stock Picker system, a rigorous and disciplined approach to stock selection based on their low peg ratio.
 DESCRIPTION

  • The Low PEG Ratio portfolio follows a disciplined approach, selecting Canadian stocks with a low PEG ratio every mid-month. This approach is based on the Super Stock Picker system that automatically and systematically manages this portfolio, it:
    • Uses a clearly defined investment process.
    • Provides diversification by investment style, including both growth and value stocks from the Canadian market.
    • Does not change based on market conditions or investment trends.
  • Canadian stocks are selected based on research of the Toronto Stock Exchange from 2003 onwards.
 PERFORMANCE

 Return Since Inception

Strategy Return Since Inception
  Download history as csv:
 HOLDINGS

 Company And Performance

 Neo Material Technologies Inc. 44.59 % NEM:CA  
 First Majestic Silver 107.19 % FR:CA  
 Connacher Oil And Gas Ltd. -11.11 % CLL:CA  
 Dundee Precious Metals 20.65 % DPM:CA  
 Methanex Corporation 3.51 % MX:CA  
 Pacific Rubiales Energy Corp. 0.67 % PRE:CA  
 Minefinders Corp. 20.61 % MFL:CA  
 Thompson Creek Metals Company Inc. -1.59 % TCM:CA  
 Petrobank Energy And Resources Ltd. -4 % PBG:CA  
 Petrobakken Energy 7.93 % PBN:CA  
 Harry Winston Diamond Corp. -26.18 % HW:CA  
 Genworth Mi Canada 2.9 % MIC:CA  
 Capstone Mining 17.91 % CS:CA  
 Barrick Gold Corporation -6.36 % ABX:CA  
 Semafo Inc. -15.26 % SMF:CA  
 Calfrac Well Services Ltd. -10.54 % CFW:CA  
 Precision Drilling Corporation -2.35 % PD:CA  
 Dollarama Inc. 16.95 % DOL:CA  
 Alamos Gold Inc. 11.92 % AGI:CA  
 Savanna Energy Services -11.76 % SVY:CA  
 Cga Mining 30.37 % CGA:CA  
 Western Energy Services 11.46 % WRG:CA  
 Canadian Natural Resources Limited 16.09 % CNQ:CA  
 Suncor Energy Inc. 26.5 % SU:CA  
 Talisman Energy Inc. 6.17 % TLM:CA  
 Wi-Lan Inc 4.17 % WIN:CA  
 Canyon Services Group -4.47 % FRC:CA  
 Silvercorp Metals Inc 11.36 % SVM:CA  
 Home Capital Group Inc. 8.69 % HCG:CA  
 Avion Gold -5.06 % AVR:CA  
 Pace Oil And Gas Ltd. 32.26 % PCE:CA  
 Fairborne Energy Ltd. -3.25 % FEL:CA  
 Horizon North Logistics 3.63 % HNL:CA  
 Linamar Corporation 20.45 % LNR:CA  
 Martinrea International Inc 15 % MRE:CA  
 Trican Well Service Ltd. -2.75 % TCW:CA  
 Centamin Egypt 6.25 % CEE:CA  
 Primero Mining Corp. -17.91 % P:CA  
 Maple Leaf Foods 3.25 % MFI:CA  
 Russel Metals Inc. 4.23 % RUS:CA  
 Anderson Energy -7.14 % AXL:CA  

 * You can get all the historical orders since the portfolio's inception.
 RETURNS

 Compounded Returns

Strategy Monthly Compounded Returns
  Note: 3-year and since inception returns are annualized.
 INDUSTRY DIVERSIFICATION

 Sector Mix

Strategy Sector Mix
 ADDITIONAL INFORMATION

 Historical Orders Since Inception

 All buy and sell orders generated to build this portfolio since inception can be found here.
 VOLATILITY RATING
Strategy Volatility Classification


Copyright ©2004-2012 Agnosoft